Testing STON
STON can be tested relatively easily. STON development fully separated the GUI from the back-end functions. You can test both separately.
Back-end functions
To test the backend part of STON you need to use the terminal and the command line interface (see Getting started):
[me@mymachine]: ston --test
Here it will ask you what you want to test:
[me@mymachine]: ston --test
What test do you want to run?
[utils/processing/segmentation, just press enter for all]:
You can either press enter for the full test suite or write utils or processing to test some parts only.
This part of the testing uses the unittest module, part of the standard library.
You can also use pytest. For this you must go to the installation directory of STON and run pytest ston/tests/segmentation.
A few details:
utils: This will test everything that deals with finding files, saving/opening txt files, reading configuration.processing: This will test everything that deal with images creation (mashup, metaimage, etc).segmentation: This will test the region identification.
Graphical Interface
We did not write unittests for the graphical interface. Instead we have stored test data in the package and you can follow the following procedure to test the main functionalities of the interface. The STON documentation has been written with these test_data so you can actually follow the documentation and test the tool at the same time.
To start the GUI in test mode just use the following command:
[me@mymachine]: ston --config test
When starting, STON will start two windows: the Main window and the Individual image visualisation window.
Main window
The Main window should give you access to the following data (on the left file explorer):
singletif –> 1 image
logo –> 1 image
cluster1_1sthalf –> 5 images
dummy_analysis –> 2 images
3rd_level –> 4 images
cluster2 –> 10 images
cluster1_2ndhalf –> 5 images
If you deploy the 3rd_level directory, and double click on ceramic3.jpg and ceramic2.jpg, images will be displayed on the right part of the window. You should have the following window at this point:
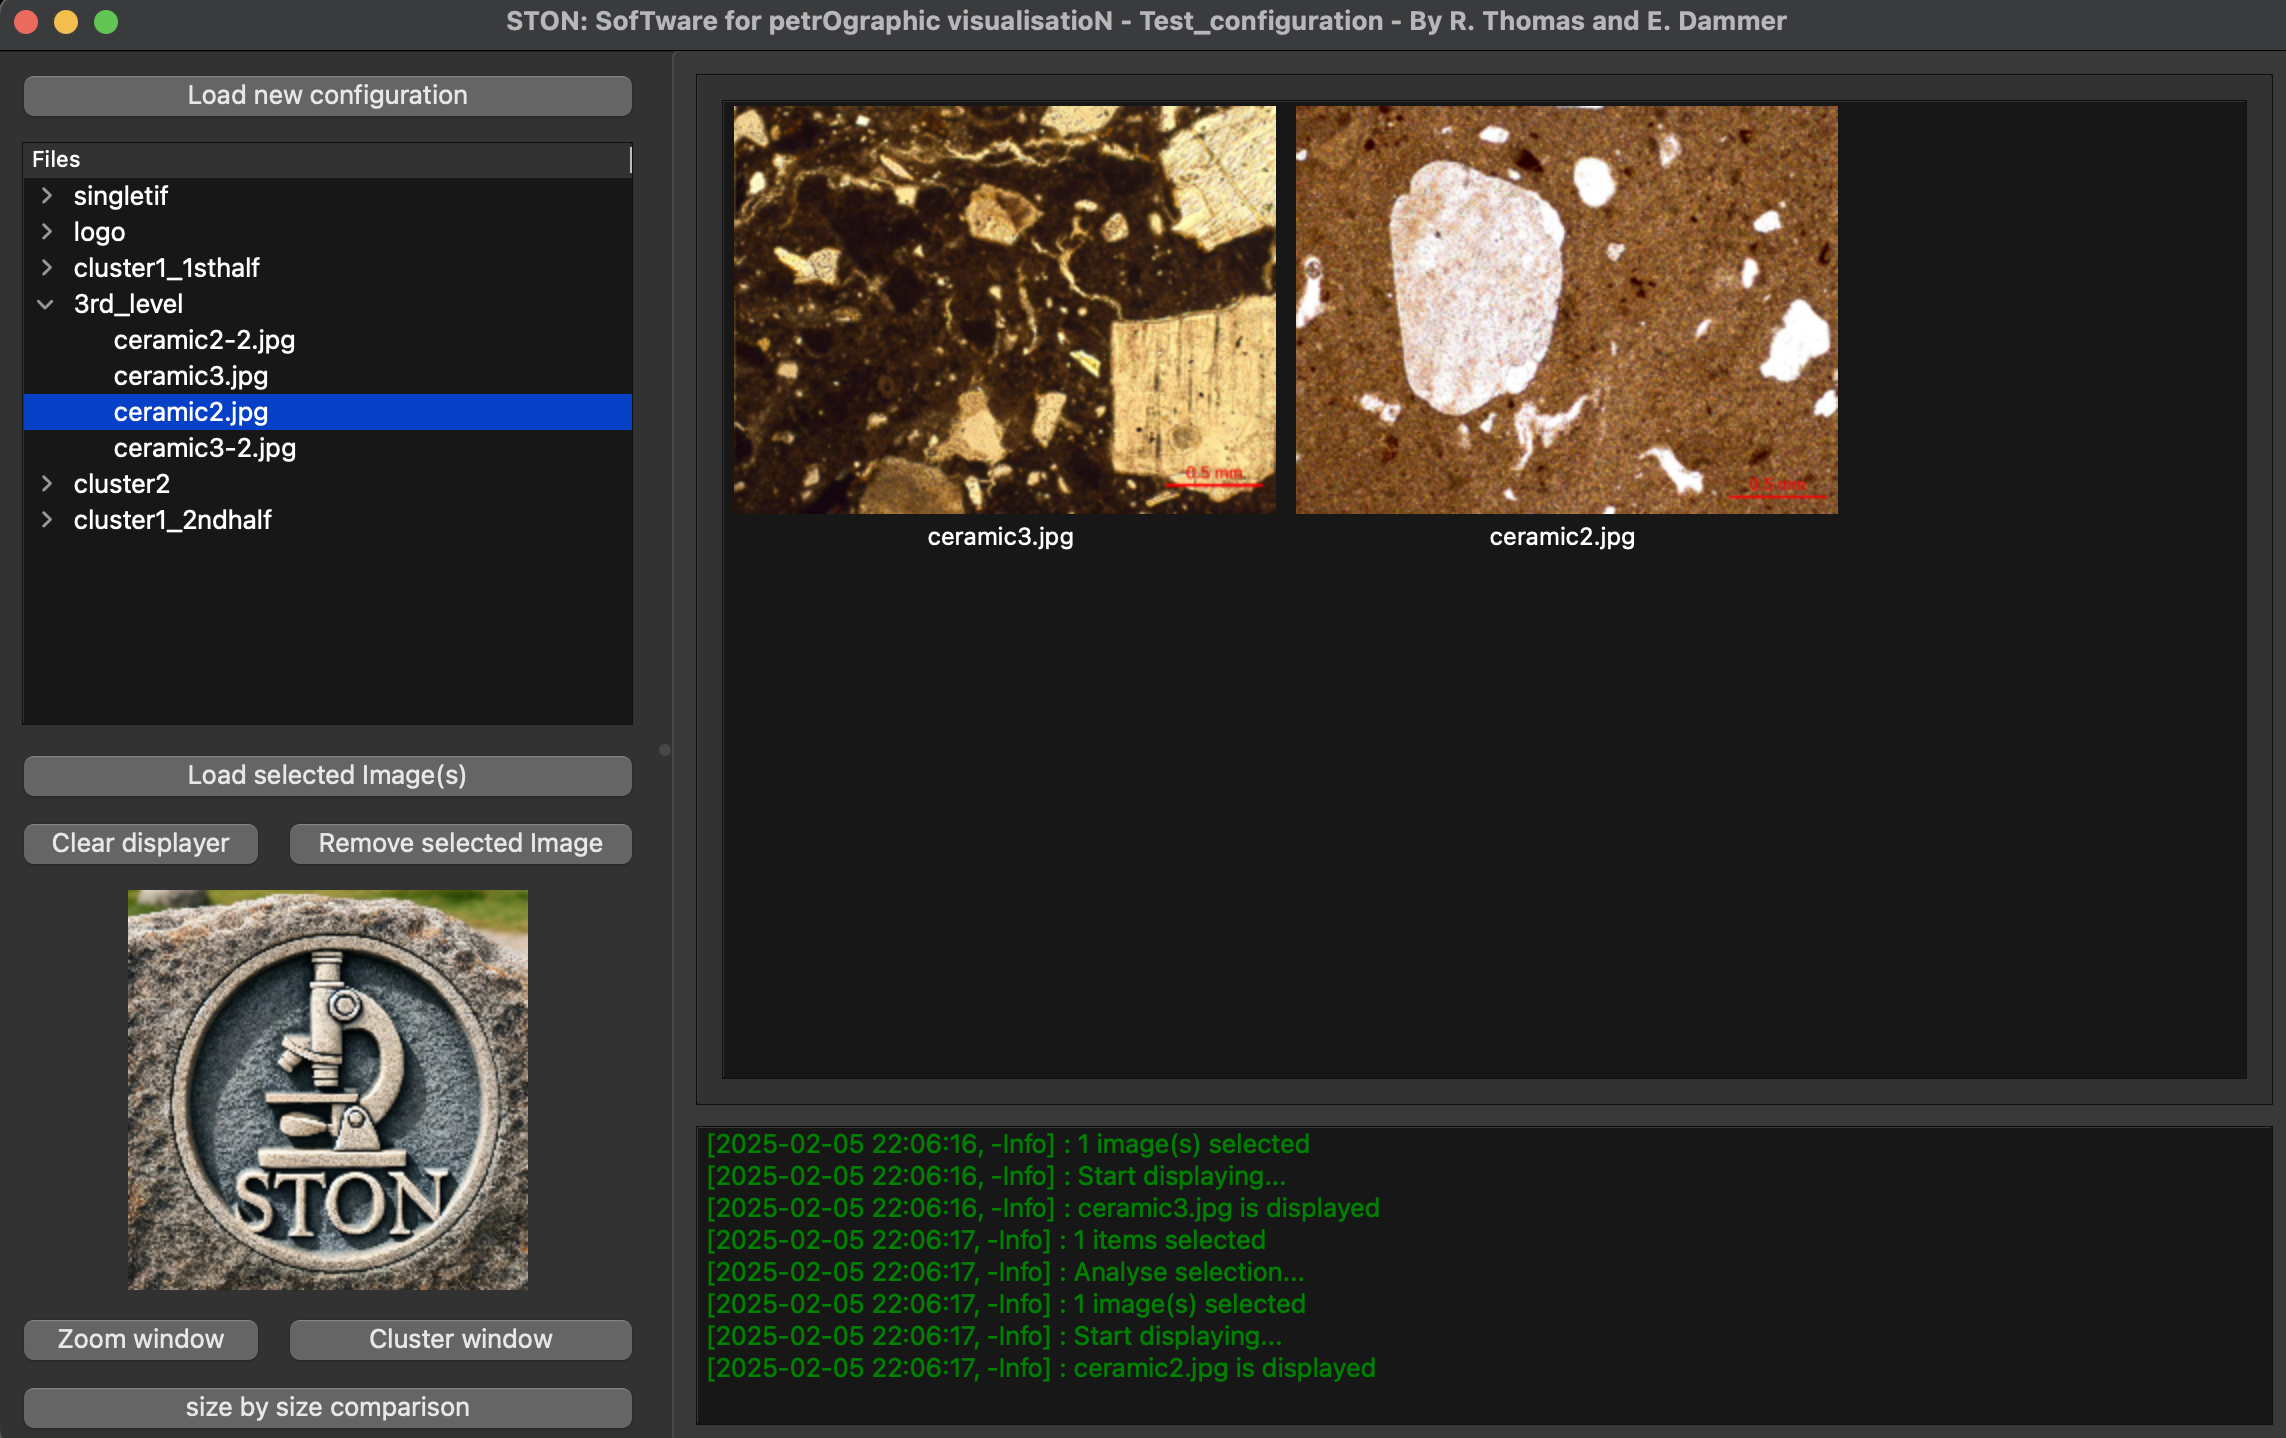
Main window of STON with ceramic3.jpg and ceramic2.jpg open on the display area
Zoom window
If you double click on ceramic3.jpg in the image area, you can go to the second window (the detail window), you should see this:
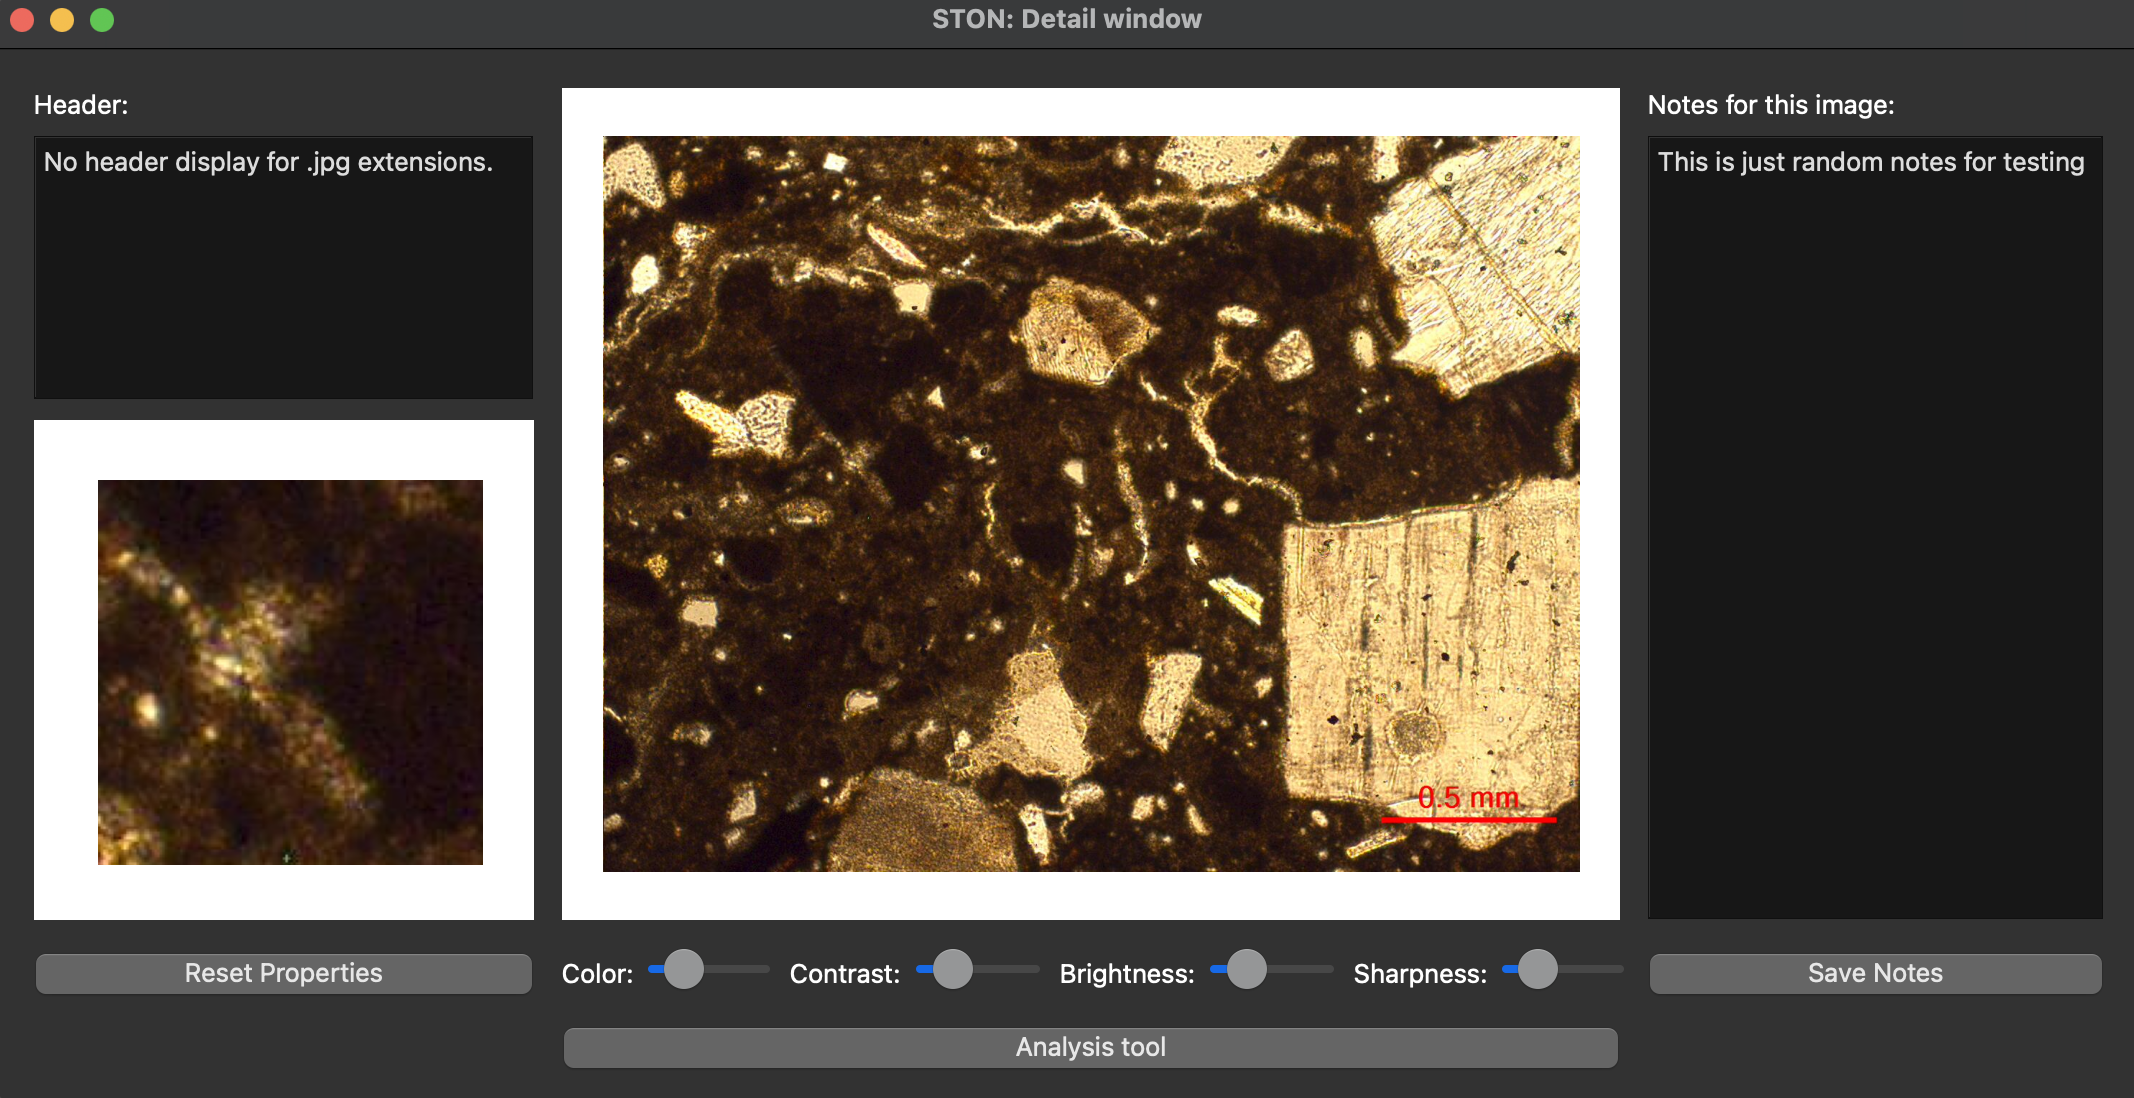
Detail window on the with ceramic3.jpg image loaded.
Passing the mouse over the image, you will see the closeup window on the bottom left showing a zoom in part of the region where mouse is (see the short video in Individual image visualisation). You can see that there are already some notes on the notepad. These are the notes displayed for testing purpose. You might modify this notes and save them back (Note: it will be saved only if the directory where ston is installed is available with write rights). As the image is a jpg, there is not metadata associated with it. If you want to check that the header display is working, you can load the image singletif/TS-ceramic.tif and you will see the following header:
ImageWidth                  4744,
ImageLength                 1048,
BitsPerSample               8, 8, 8
Compression                 1,
PhotometricInterp           2,
StripOffsets                240,
SamplesPerPixel             3,
RowsPerStrip                1048,
StripByteCounts             14915136,
MinSampleValue              0,
MaxSampleValue              255,
XResolution                 2400, 1,
YResolution                 2400, 1,
PlanarConfigurati           1,
ResolutionUnit              2,
PageNumber                  0, 0
NewSubfileType              0,
And the following image:
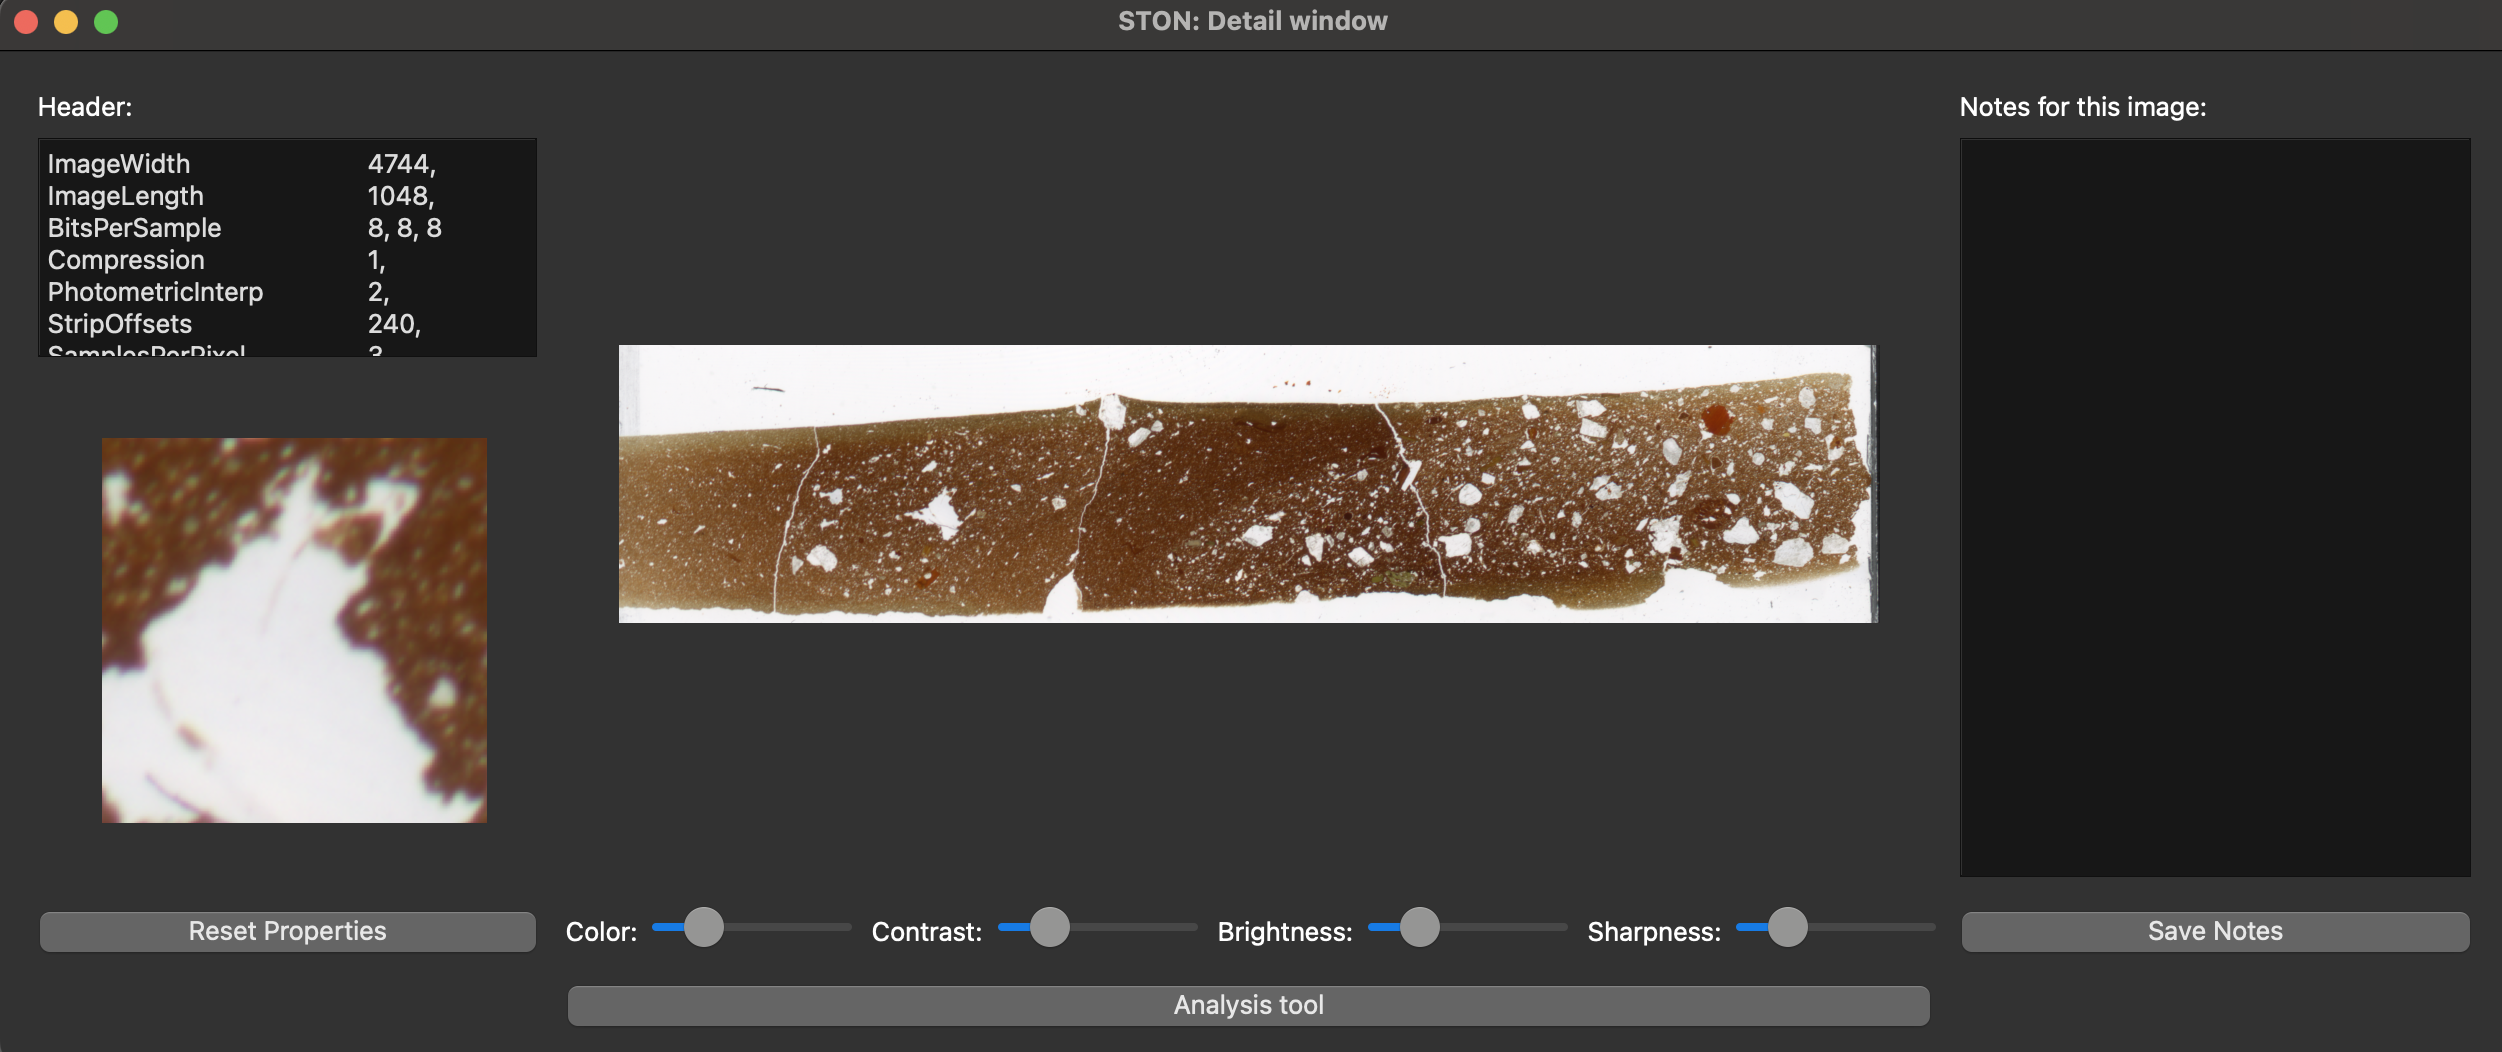
Zoom window with header display
As described in Individual image visualisation, you can adjust the enhancers (color, contrast, etc) to change the property of the image.
Cluster window
If you load all the images under the directory cluster1_1sthalf you can then open the cluster window. You will find yourself in the same setup as in the Grouping images, with the exact same images. To create a mashup image, you need to select the order in which the images will be associated. Follow the image names and you will get the same mashup as in Grouping images.
Side by side comparison
If you select ceramic3.jpg and ceramic2.jpg and click on size-by-size comparison, you will have the corresponding window appearing. The page Compare images shows you how to change the zoom with a small video.
Analysis window
To test that the Analysis tool works correctly you can load the two images under dummy_analysis. These images are made-up images that are made of artificial shapes (colored or white) on a black background. If you load them in the analysis tool you and run the region identification (without any filtering or cropping), you should see these two region indentifications:
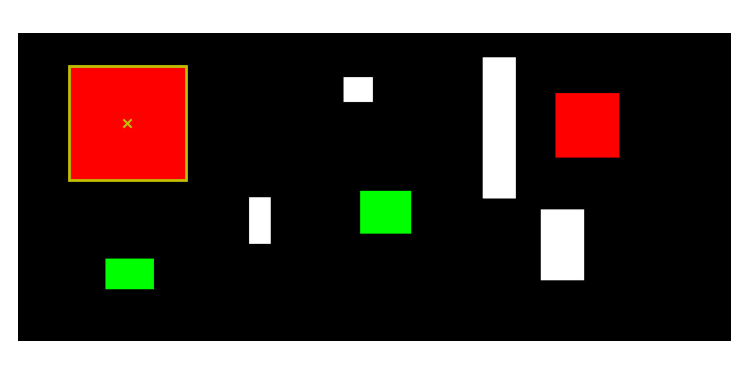
test_segmentation Region explorer panel.
For test_segmentation, all shapes are squares or rectangle so you might not see the boxes around the shapes. But you should get the following statistics:
Region identification (look at corresponfing panel):
Ratio of black regions [%]: 86.0
Ratio of white regions [%]: 14.0
Number of regions identified: 8
Smallest region: 1794.0 pixels
Largest region: 32757.0 pixels
For the second image (test_segmentation2). shapes are not squared and you should see the following:
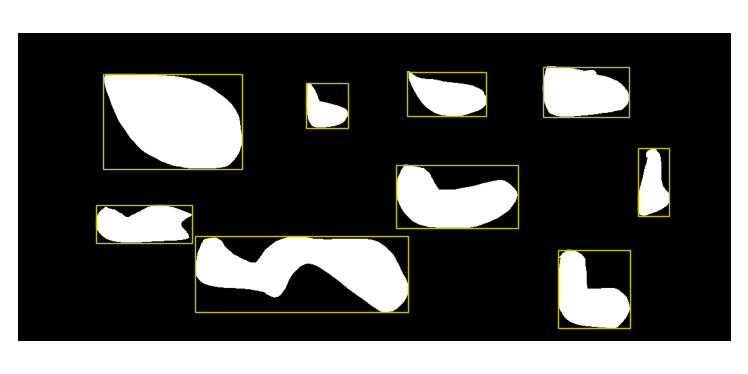
test_segmentation2 All regions panel.
In addition, the information on region identification should give you:
Region identification (look at corresponfing panel):
Ratio of black regions [%]: 83.0
Ratio of white regions [%]: 17.0
Number of regions identified: 9
Smallest region: 2544.0 pixels
Largest region: 23835.0 pixels