Analysis window
The analysis window allows you to segment images and identify regions of interest in the image. When opened, it will display the same image as in the Individual image visualisation window:
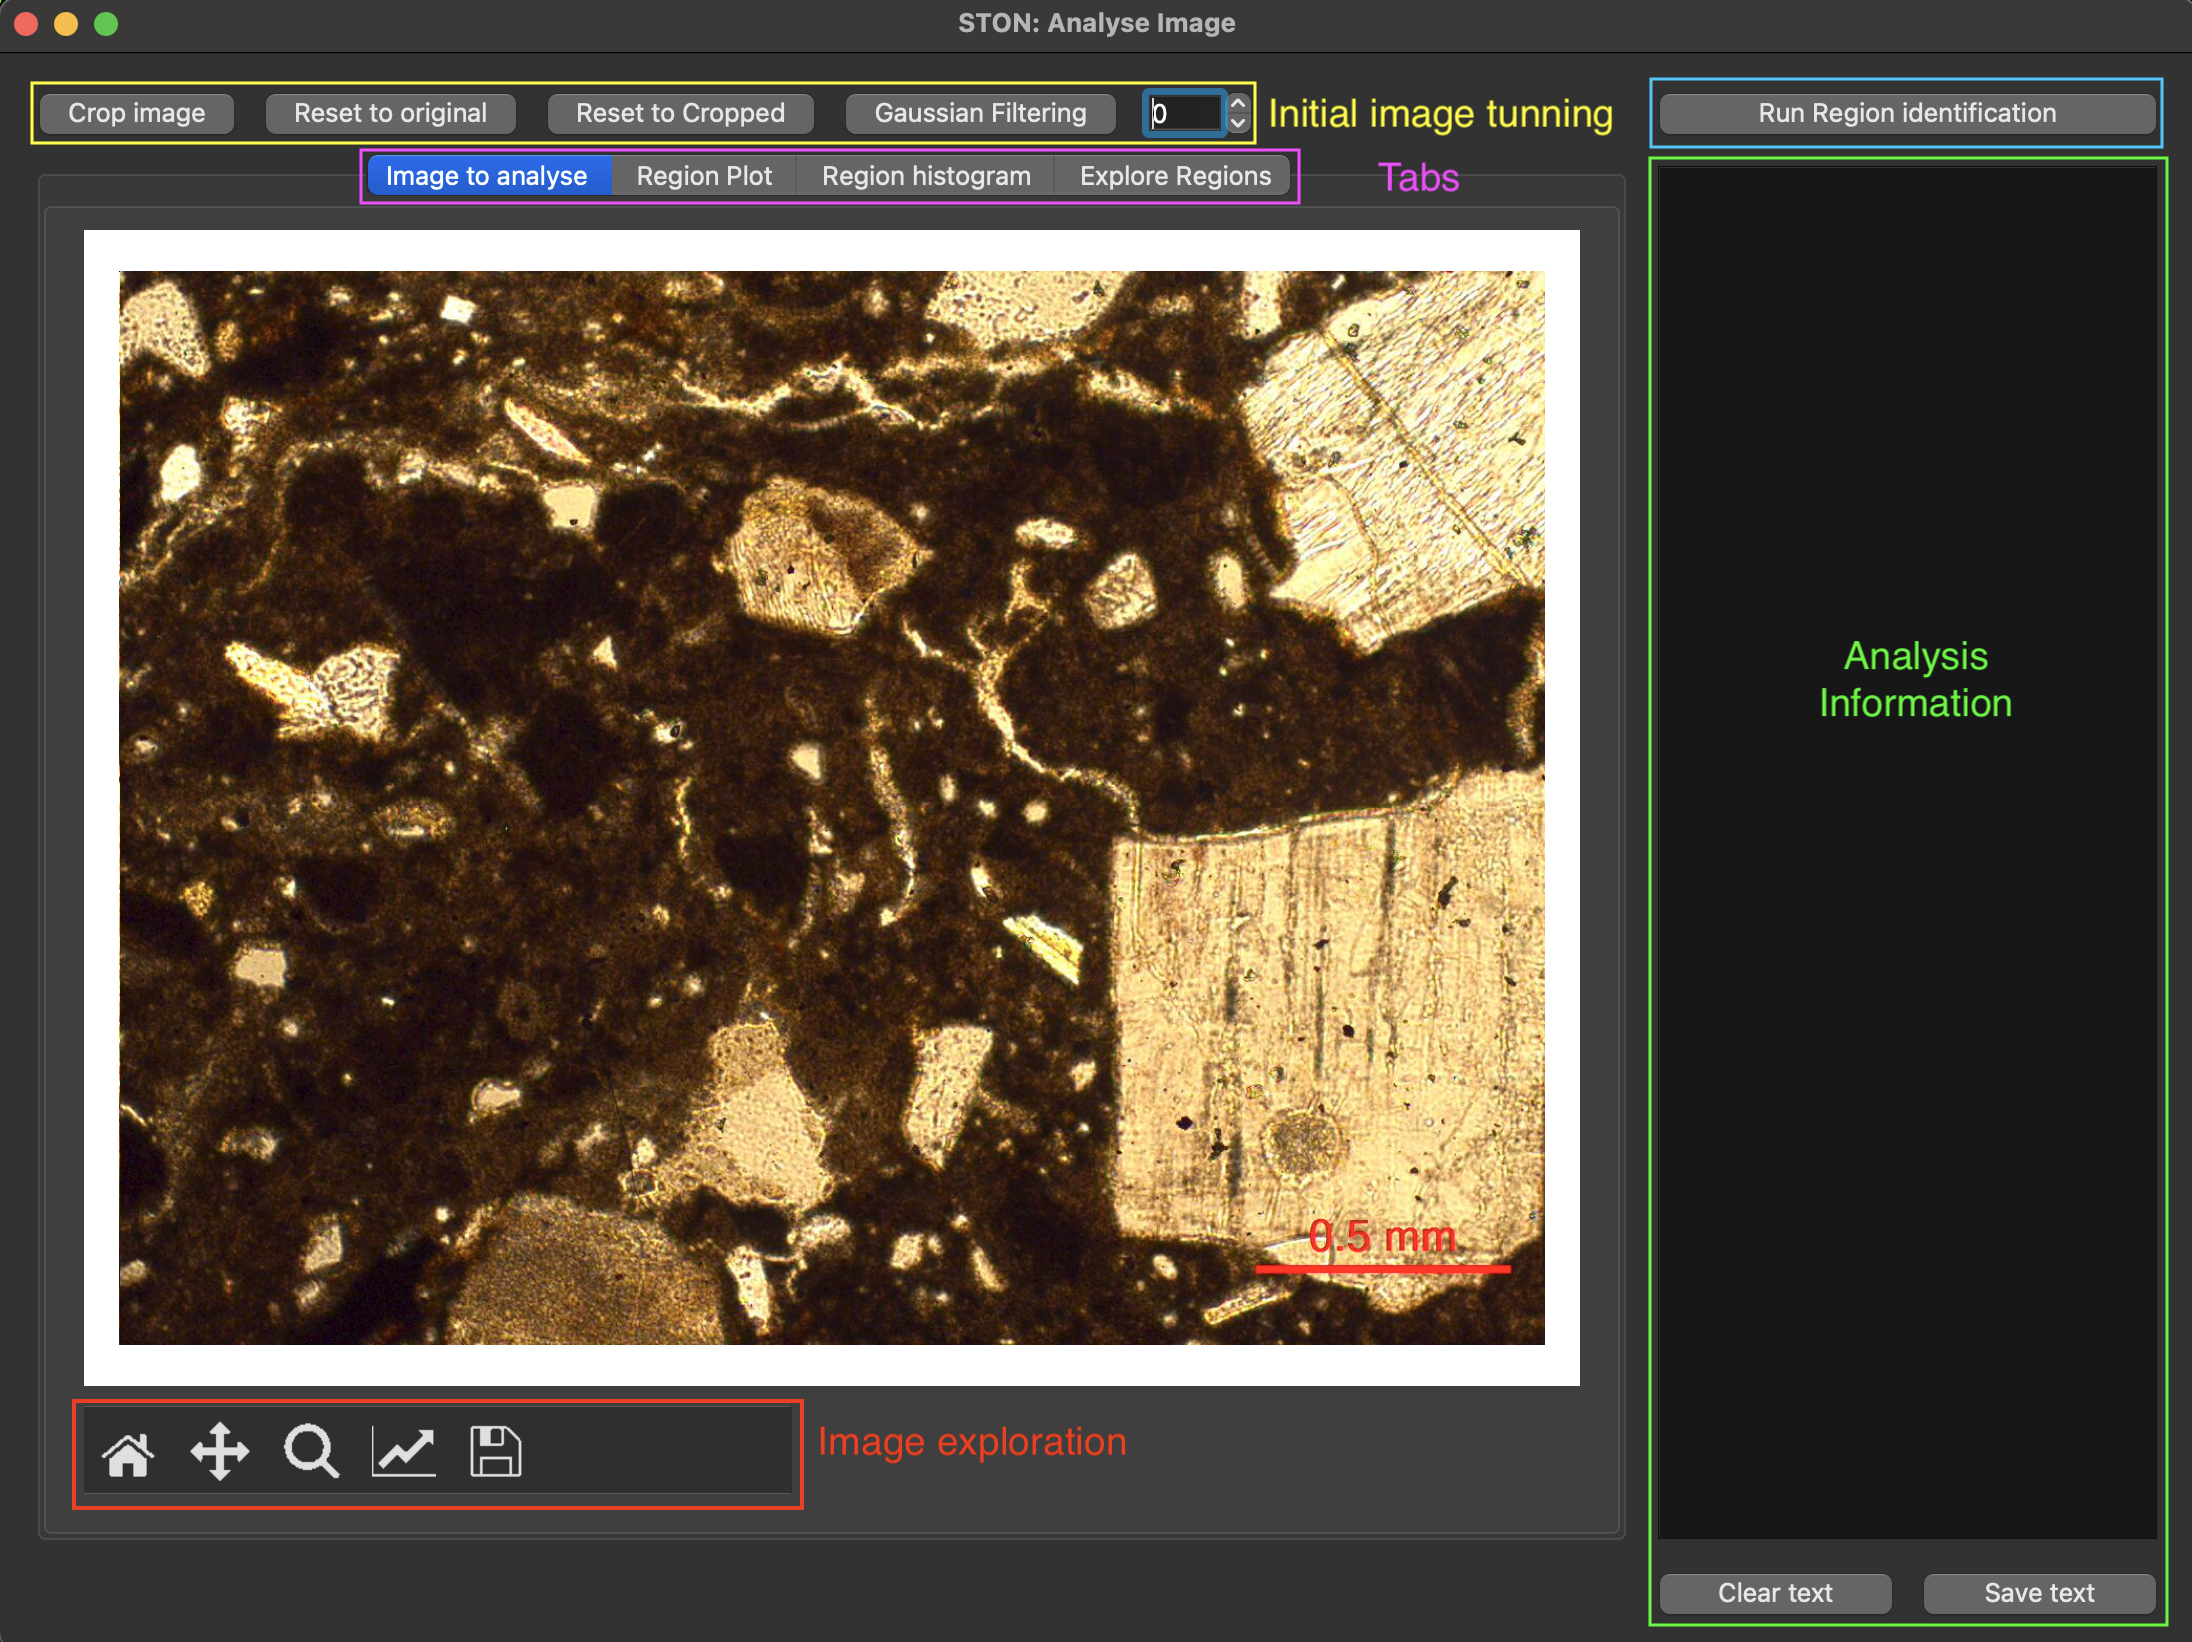
Analysis window
The analysis window is composed of the following areas:
Tabs (pink): This is where you will see images. It is always displaying the tab ‘Image to analyse’ at first. The other tabs (region plot, region histogram, explore regions) are all empty. At the bottom of each tab you will see the matplotlib toolbar (in red). This allows you to zoom in/out, save the image.
The initial image tuning (yellow): A few buttons to tune what image will be analyse. It can be cropped and a Gaussian filter can be applied to the image (see below).
The analysis information box (green). Each time something is done in that window, information will be displayed on that box. You can clear it or save the text using the buttons at the bottom.
Running the algorithm (blue): This is the button you need to hit for STON to make the analysis
Cropping and Gaussian filtering
Cropping
In some case you might want to remove areas of the image. To make this easy we implemented a cropping option. To crop an image you must use the lense button at the bottom of the window (in the ref box in the screenshot), then select an area in the image. Once the image has been zoomed to this area you must use the button Crop Image. This will ensure that the image that will be analysed will be the cropped one. To uncrop the image and revert back to the original image, use the Reset to original button.
Gaussian filtering
It might be useful, if you want the smallest regions to not be identified, to use a gaussian filter in the image. The spinbox next to the button Gaussian filtering allows you to choose the sigma of the filter. When hitting the button, the filter will be applied to the displayed window:

Example of Gaussian filtering
Note
If you use the button while the displayed image is already filtered, the gaussian filter will be applied to that filtered image. Make sure you reload the image with Reset to Original or Reset to cropped before applying again a Gaussian filter.
The Gaussian filtering used here is the one of skimage (see here).
Identifying regions and visualisation
To analyse the image and identify regions within the image you must use the button Run Region identification (in blue, top-right corner). This will take the currently displayed image and send it to the identification algorithm. The first step uses the label function of the scikit-image measure module scikit-image library that will identify regions based on pixels values. It works only with images with integer values for each pixel. In order to create such image with create a binary image where each pixel is set to 1 if it is above the average of the image, 0 otherwise. Once this part is done with use the regionprops function that extract properties of the regions (e.g. position, areas, etc). Once ran, you will have some information displayed in the result box on the right:
Region identification (look at corresponding panel):
Ratio of black regions [%]: 66.0
Ratio of white regions [%]: 34.0
Number of regions identified: 191
Smallest region: 2.0 pixels
Largest region: 186555.0 pixels
This will give you some (hopefully) interesting information about the process.
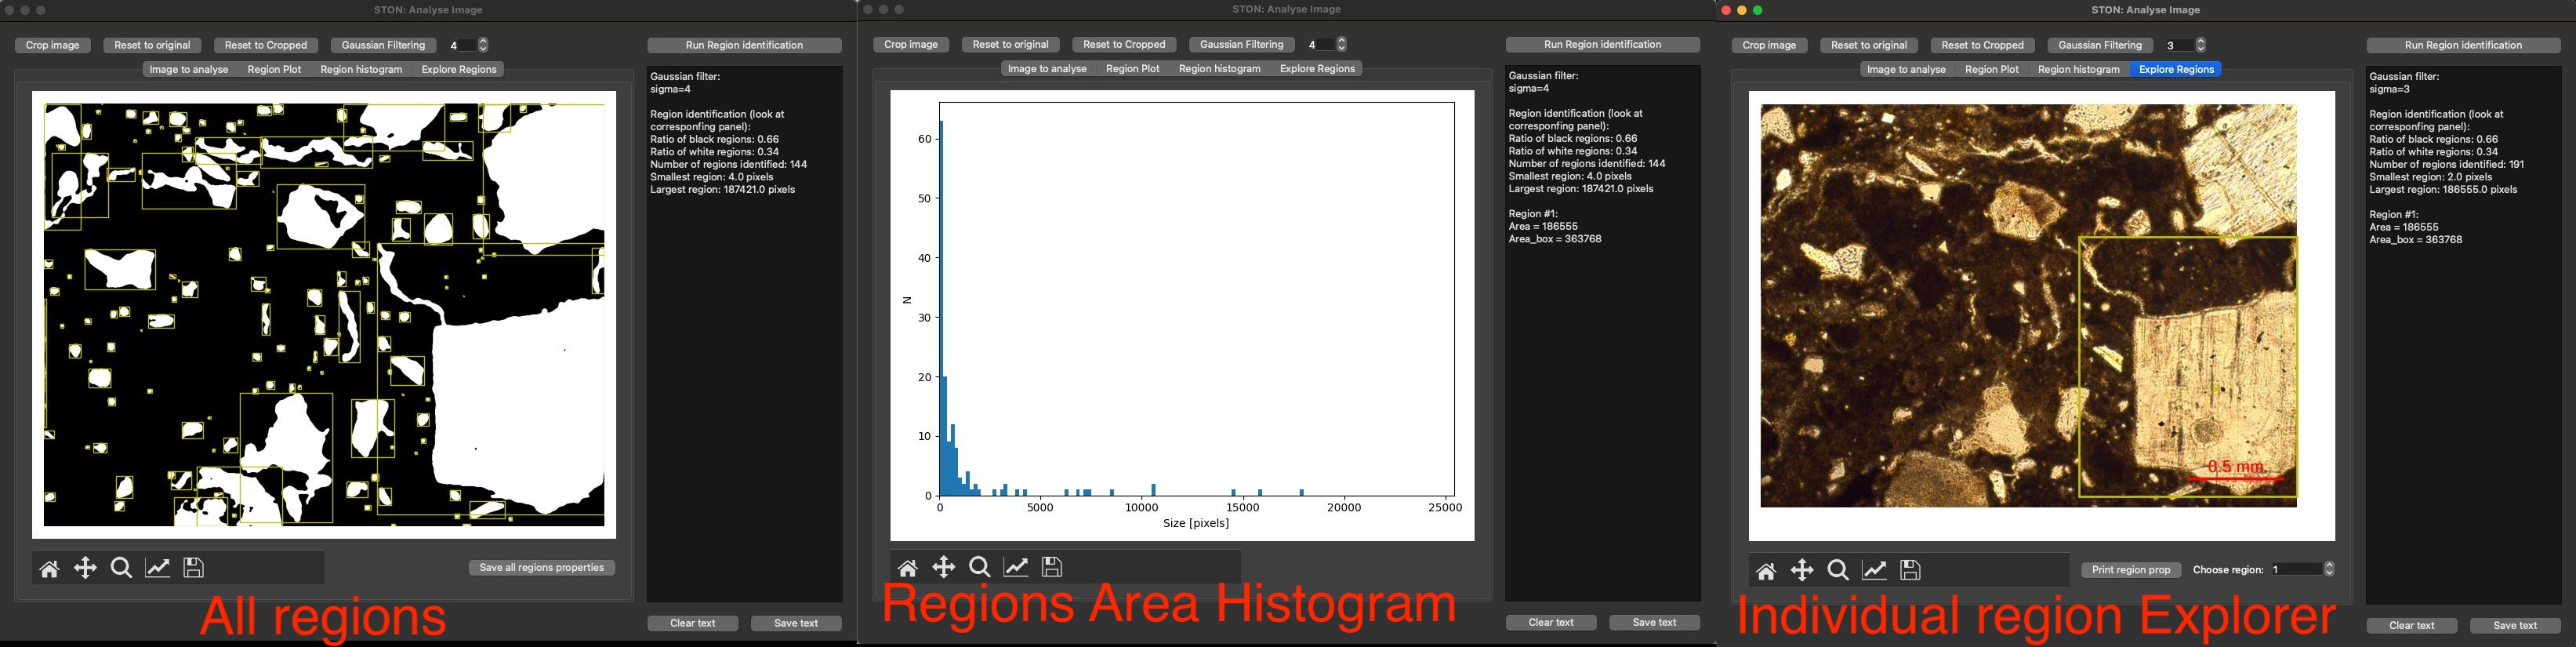
Visualisation of the identified regions in three panels
You can visualize the result of the region identification on the three panels (Region plots, Region histogram & Explore Regions):
Region plot: In this panel you will see all the region identified with a rectangle box around them (in yellow). In that panel you can also export the full list of region with their properties to a file.
Region histogram: This is a simple histogram of all the region sizes.
Explore Region: This gives you the opportunity to explore each region one by one (from largest to smallest). For convinience they are displayed on top of the image used for the analysis. You can use the choose region spinbox to display the region you want (1 is the biggest and will go to smaller ones as the region number increases). You can also print on the result box information about the displayed region.
Warning
The default configuration removes the single-pixel area. You can change this in the configuration in the Analysis section with the minimum_size parameter.